🚮 DSNY Trash Collected Report
This page visualizes NYC's Sanitation Operations (DSNY). Tonnage is the total amount of waste collected by the city. Waste collected from litter baskets is “less than 3%” of all DSNY waste according to NYC's 2024 Zero Waste Report. They are the trash bags or overfilled bins on the sidewalks that can leak, spill, and be torn open by rats. So when you see a dirty street, it is not just pedestrians.
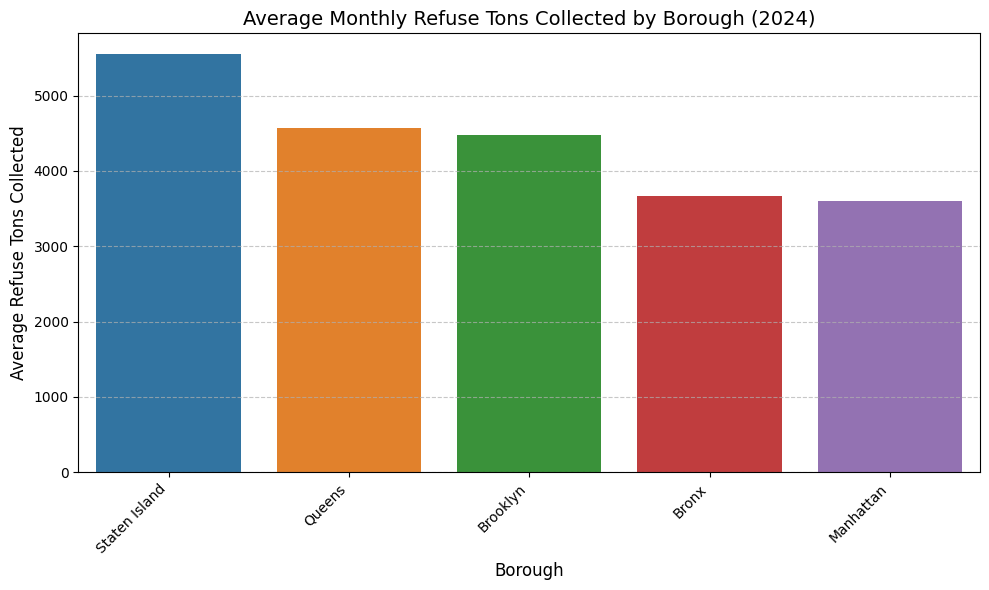
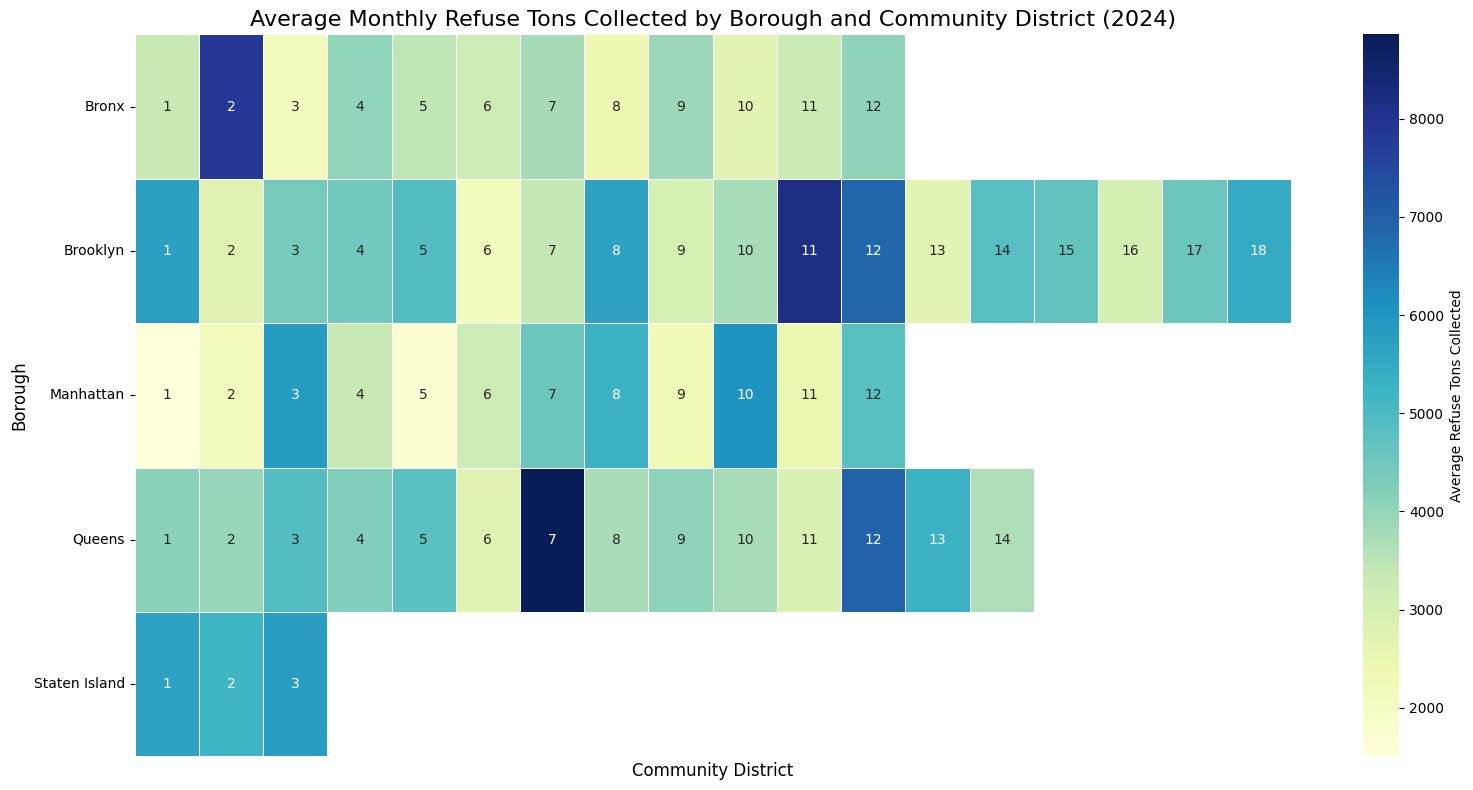
📊 1. 2024 Municipal Waste Analysis
Click any chart to view larger
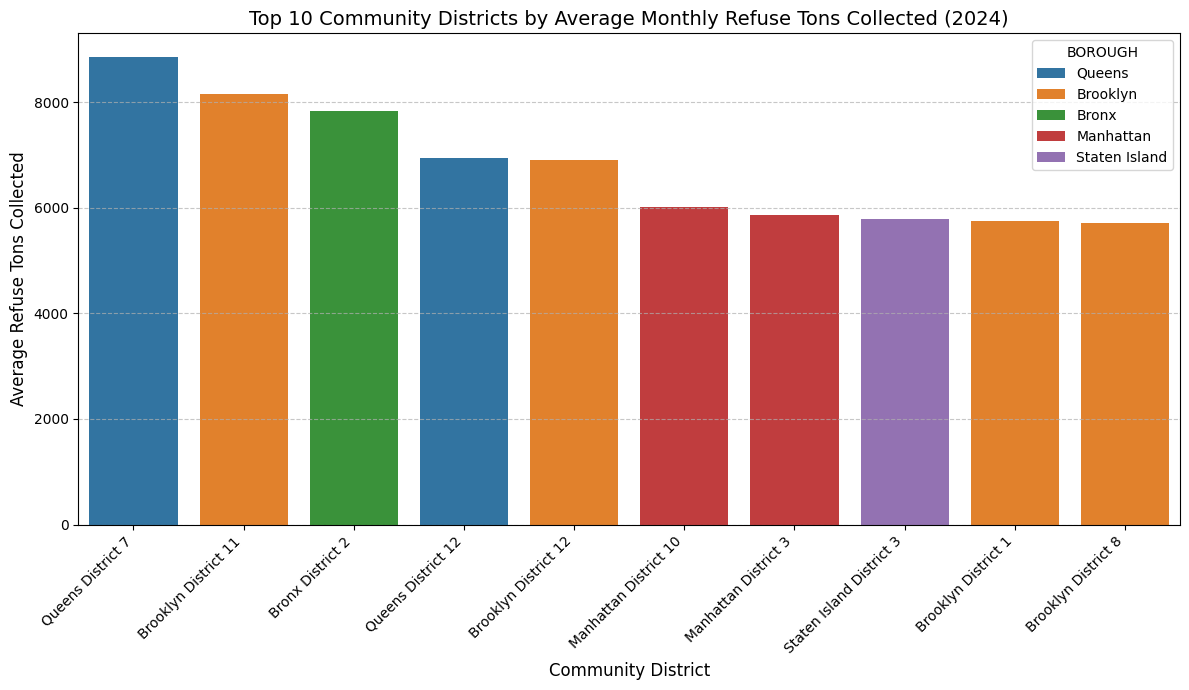
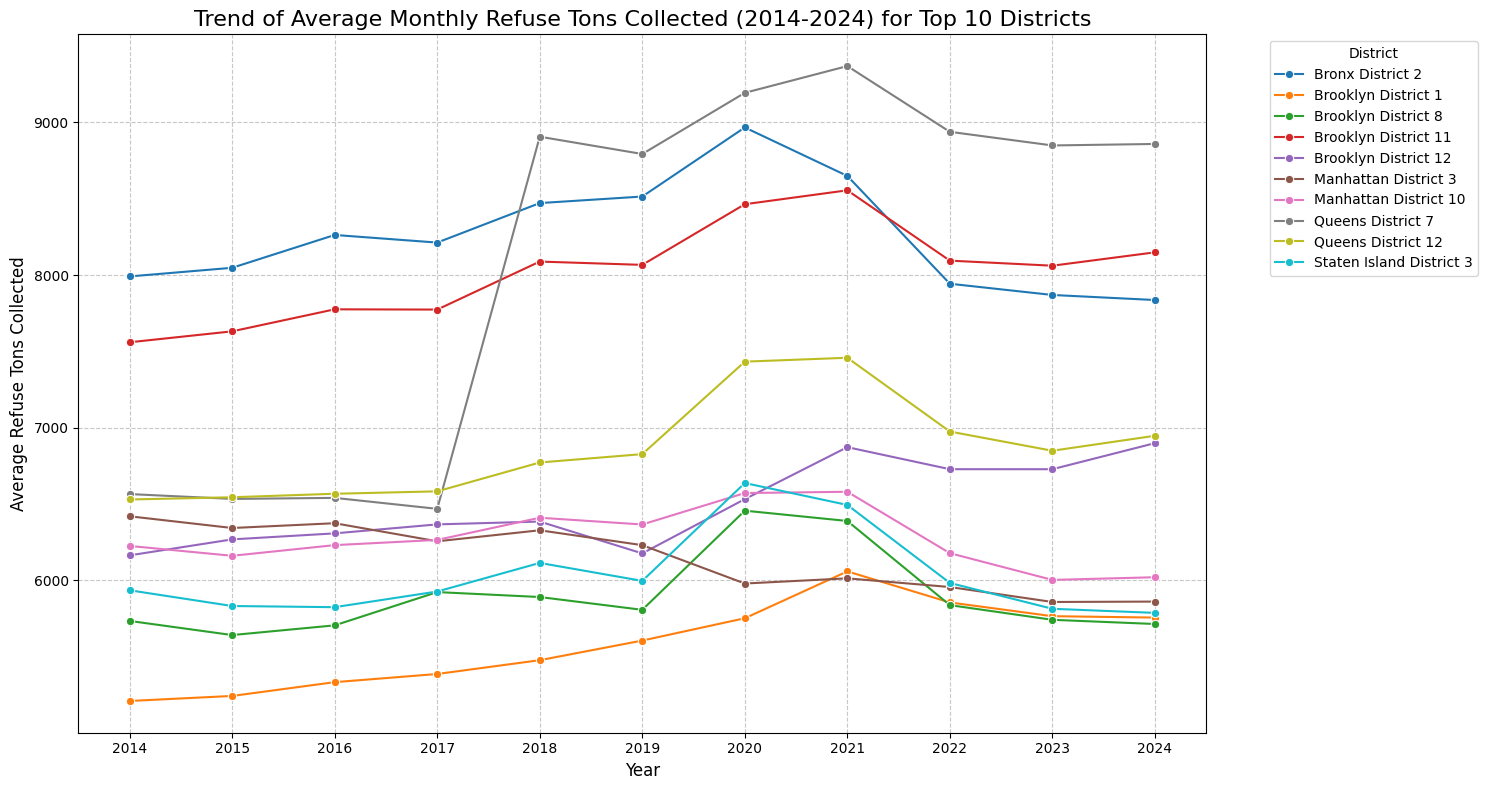
The trend shows a division between in the high trash districts: a cluster above and a cluster below. Noticibly, Queens District 7 had a significant jump from 2017 to 2018, going from below to above to becoming the highest tons collected of all the districts.
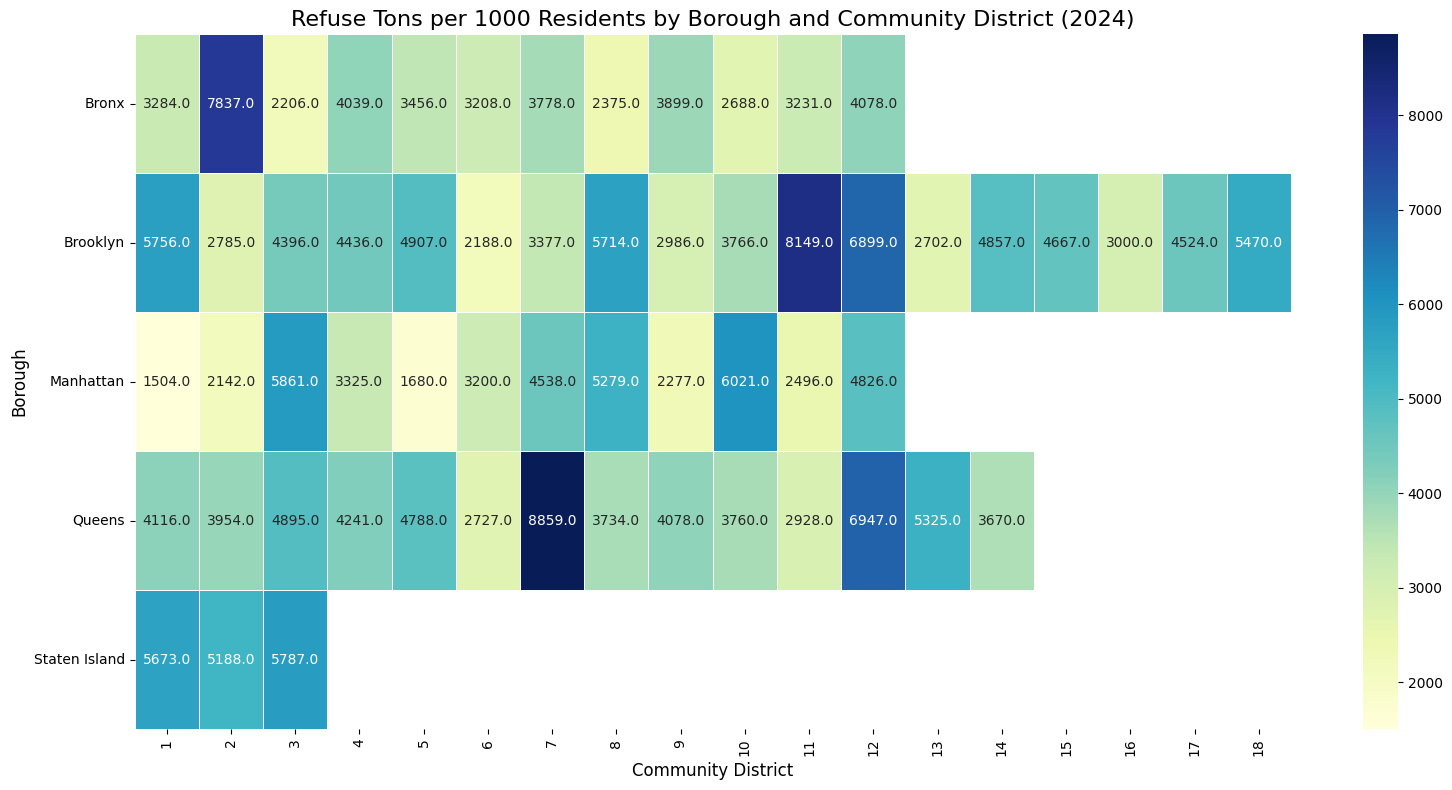
🗑️ 2. Waste Per Capita (Tons per 1000 Residents) Analysis
Click any chart to view larger
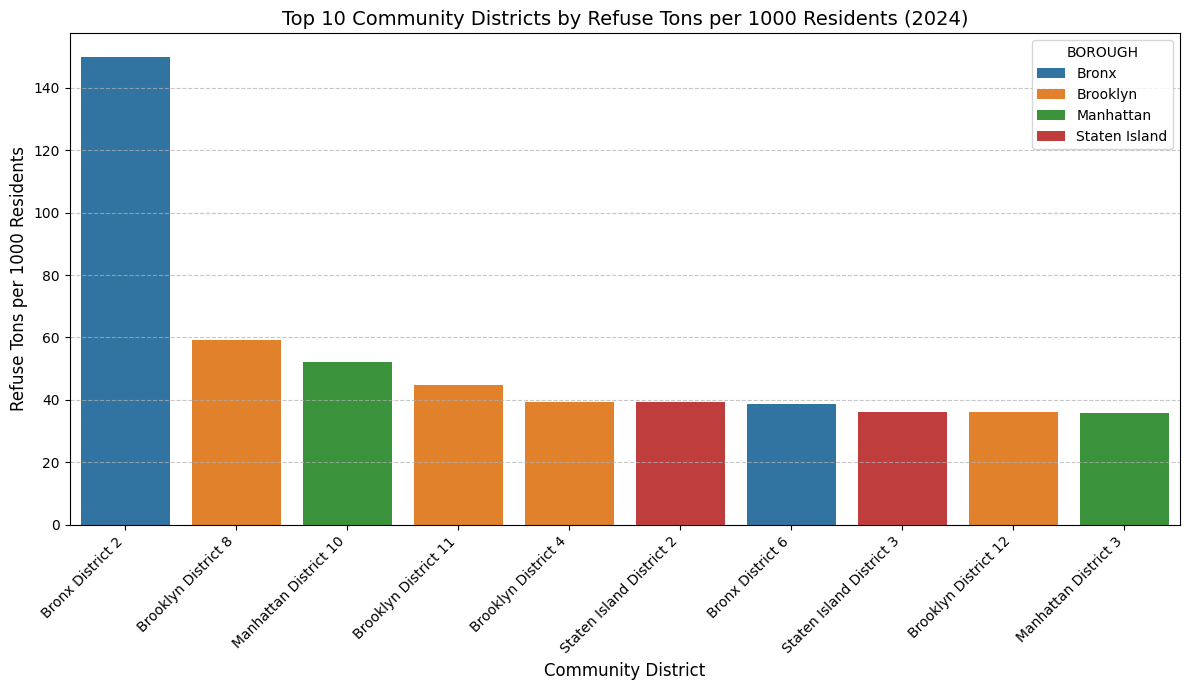
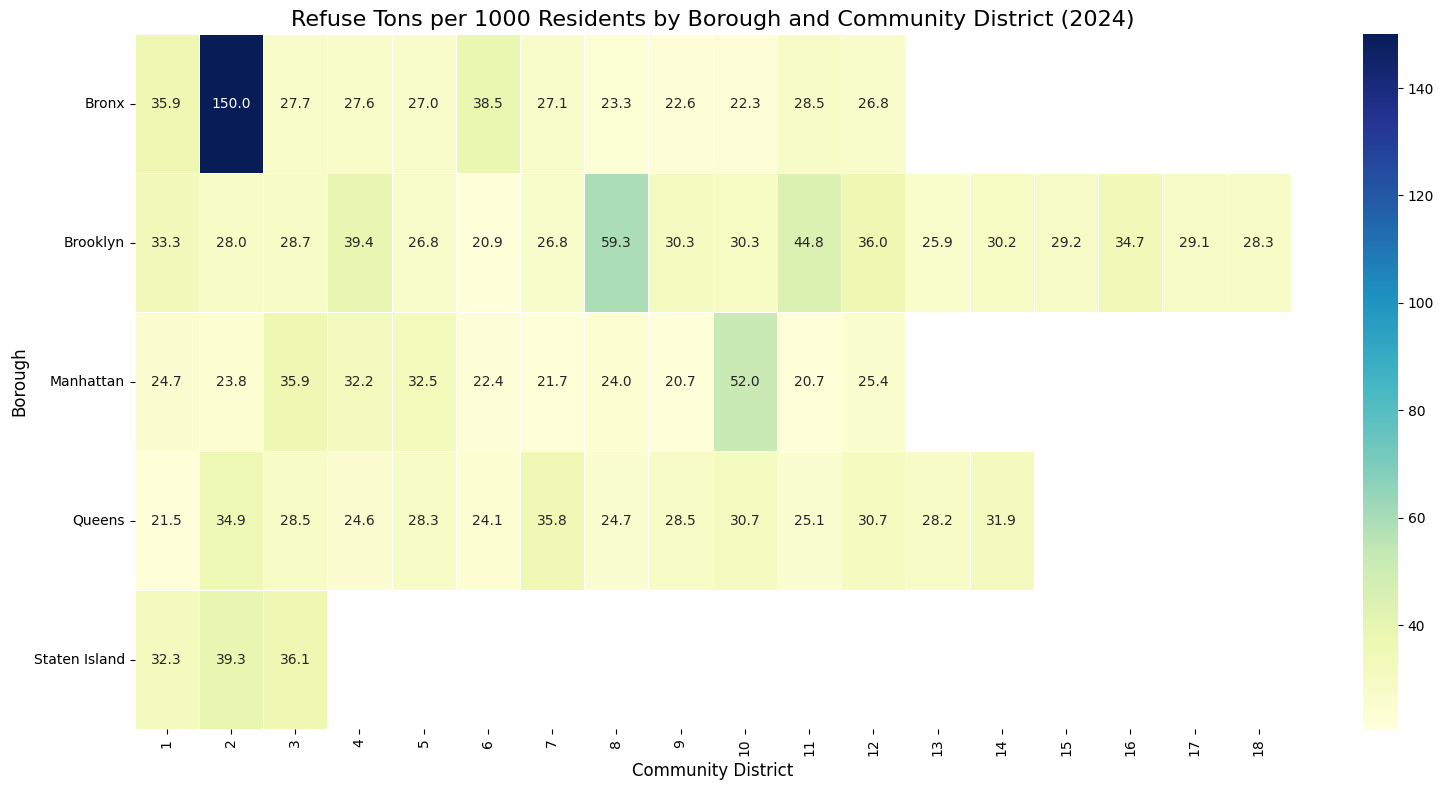
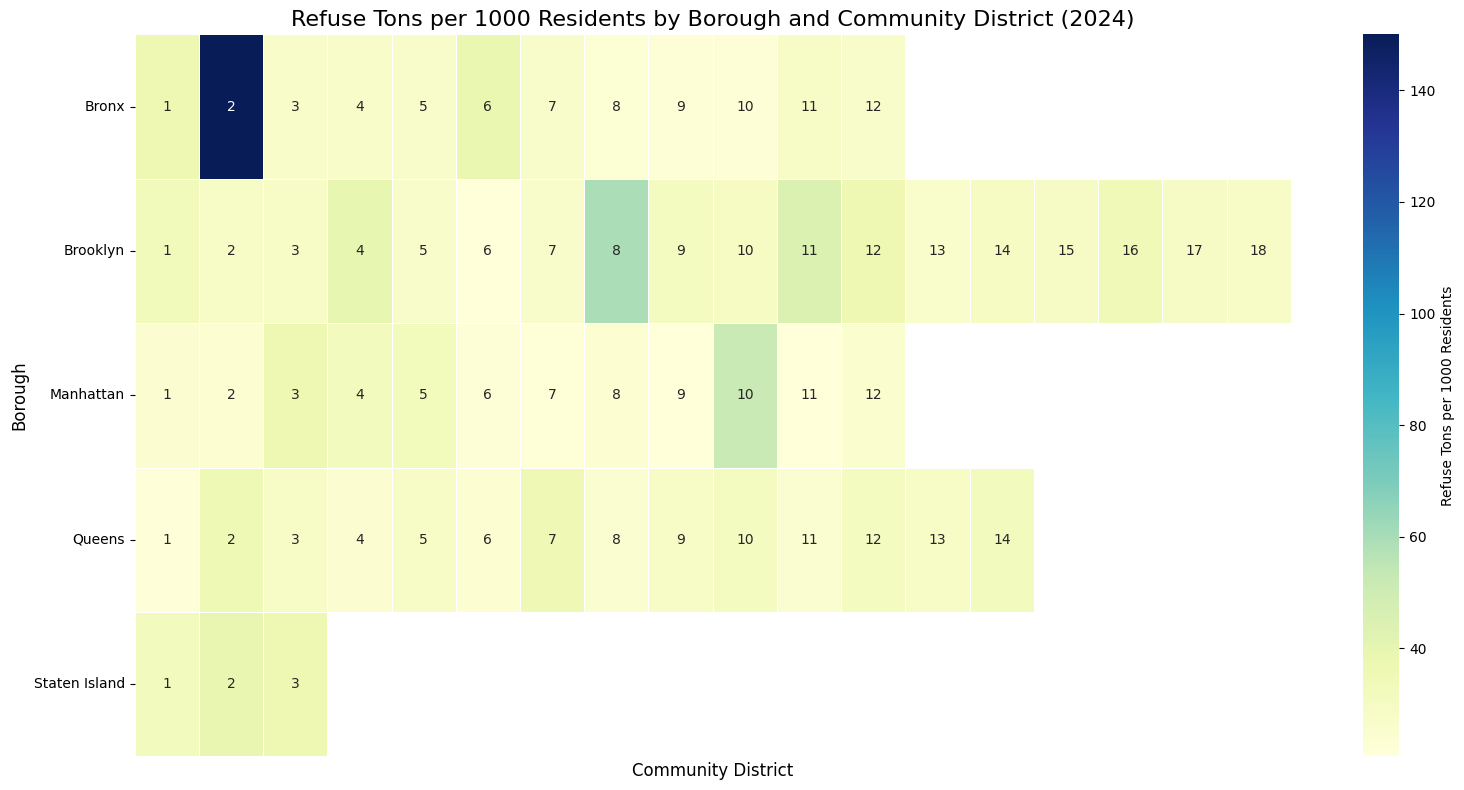
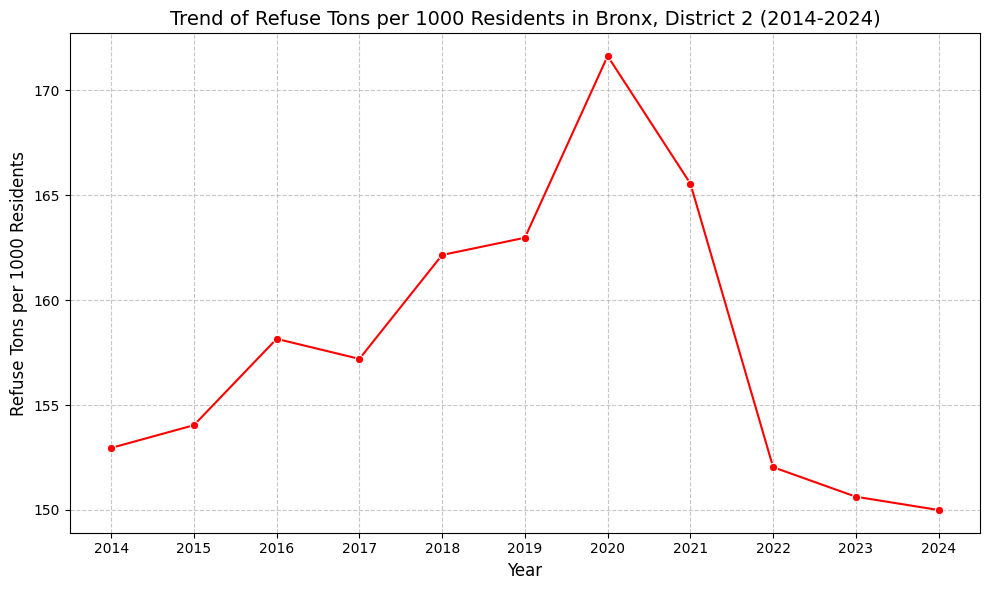
It is apparent that only one district, Bronx District 2, has an astronomical amount of trash per capita contrasted with all other districts. Looking at the past decade, it was higher and increasing until 2020, during the pandemic. The meaning here, is not that residents in that area produce more trash, but potentially high waste industrial activity in that area of the Bronx.
📞 3. 311 Complaint Analysis
Click any chart to view larger
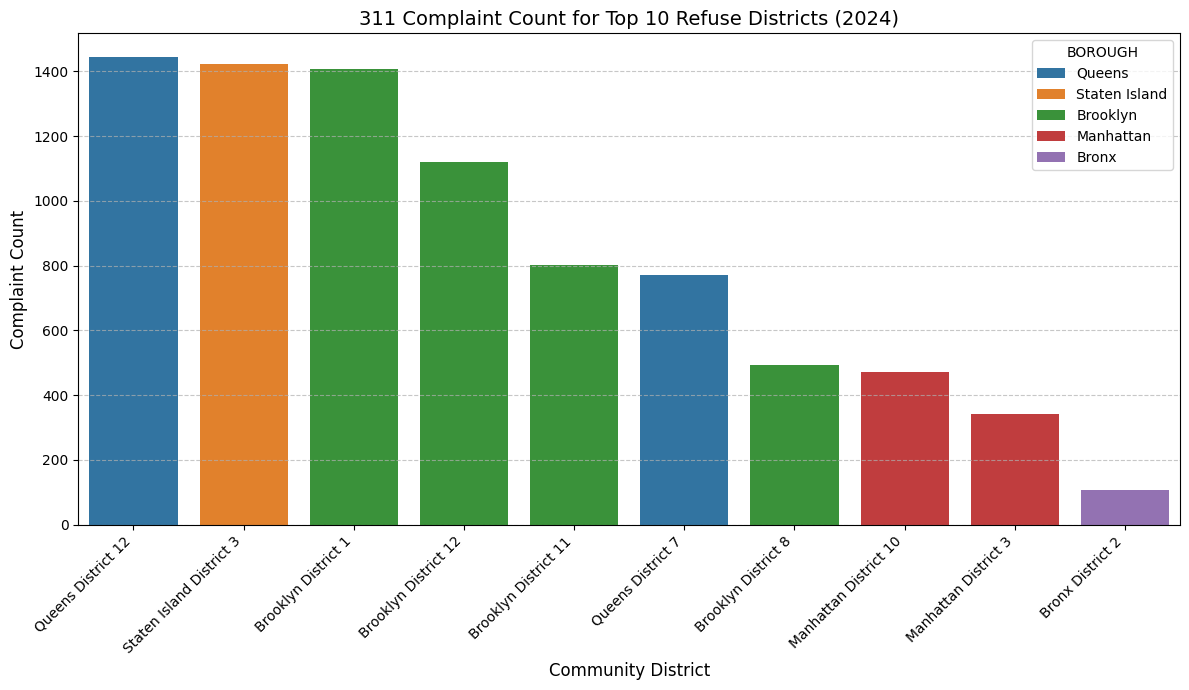
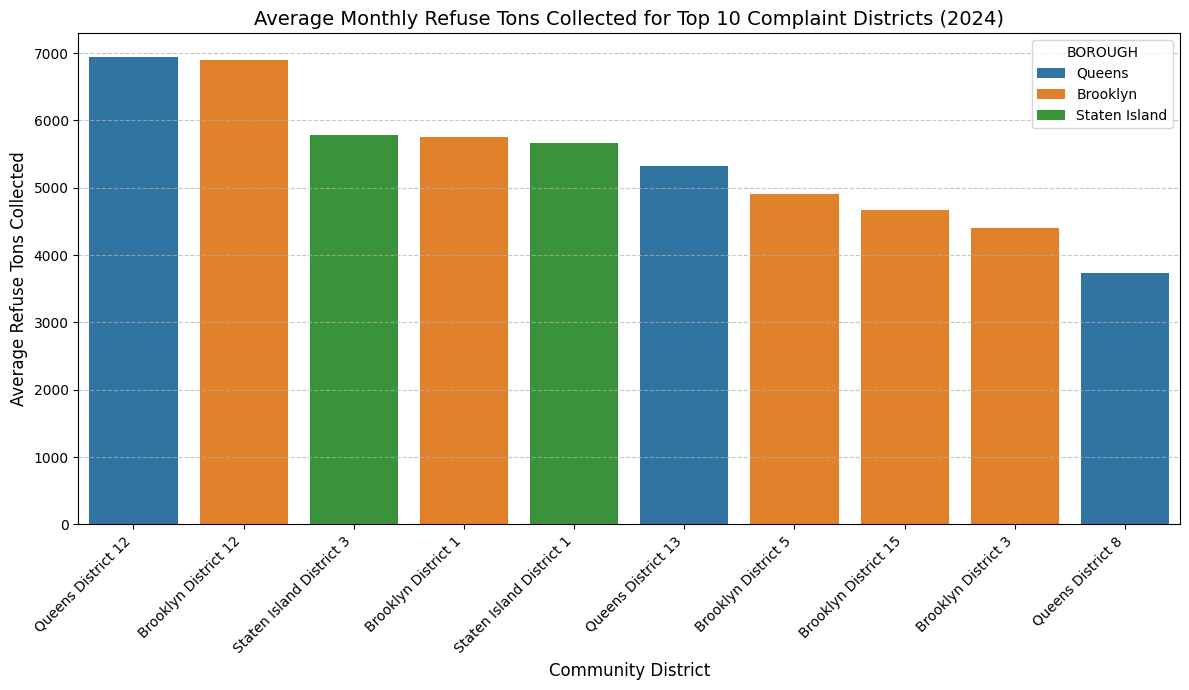
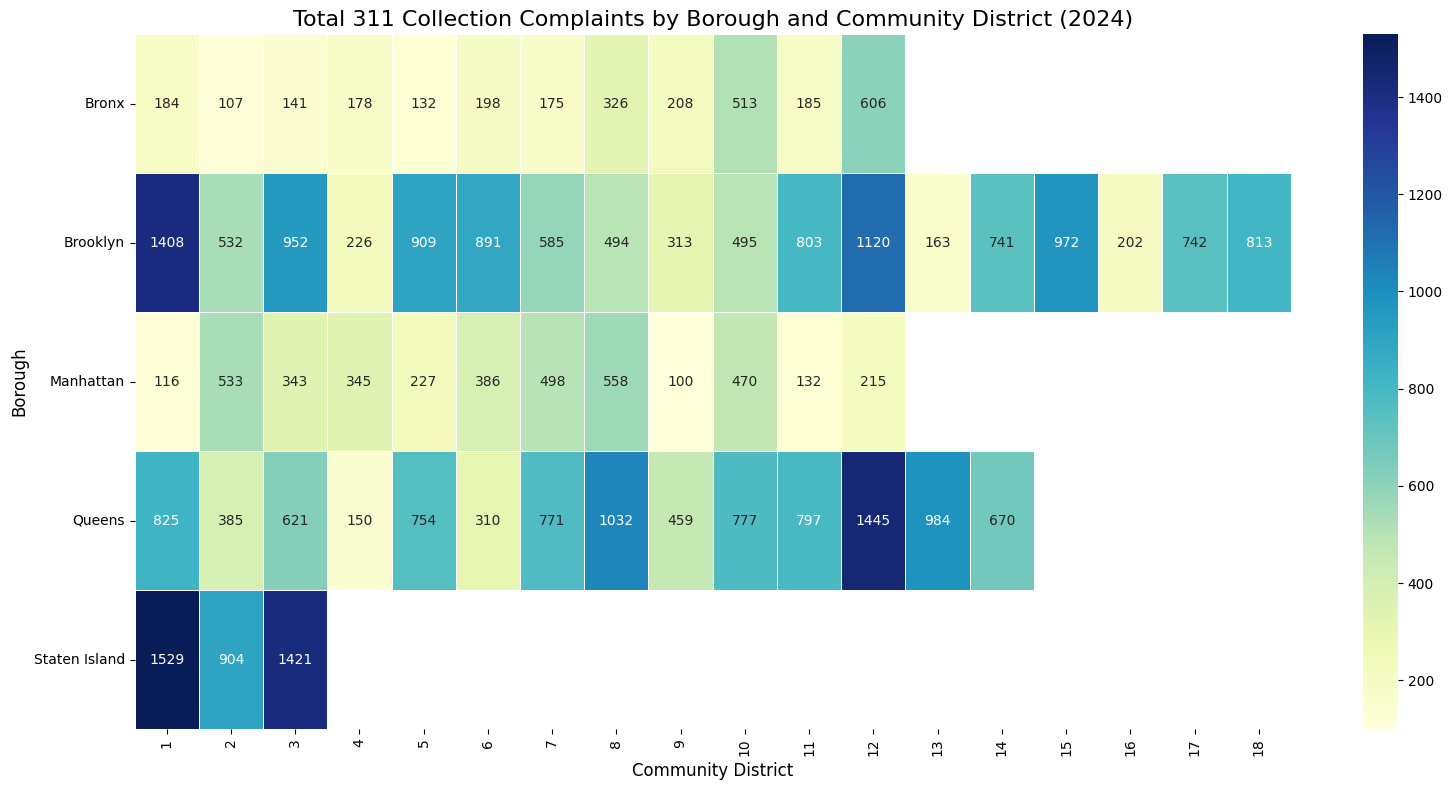
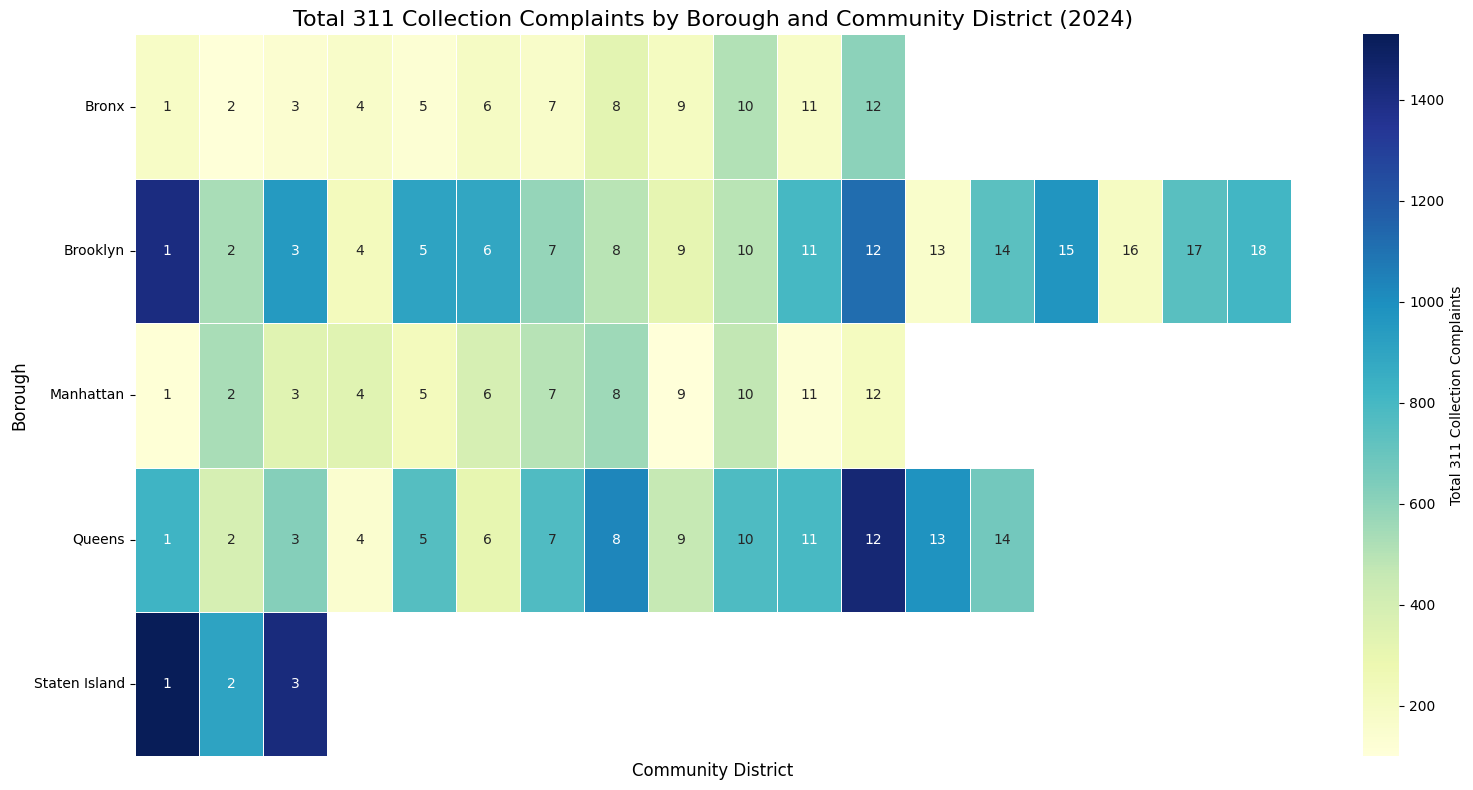
Chart 1 visualizes the number of 311 reports in the highest waste districts. Of the highest waste districts, those that have high 311 reports mean this area has a lot of trash, but poor sanitation. These areas need attention, especially the top 3. Chart 2 visualizes the amount of waste in the districts with the highest 311 reports. Interestingly, the waste amounts are pretty similar (flatter), meaning these probably are not the dirtiest areas, but other reasons for the high 311 reports.